FlowState
Know who moves the market before the market moves
FlowState monitors directional information flow between global equity markets, updated daily.
FlowState in action → click here
You specify the market pairs; FlowState tells you which is currently leading which — and how persistently — using Transfer Entropy (Schreiber, 2000) rather than correlation. The output is a ranked signal feed your desk can act on.
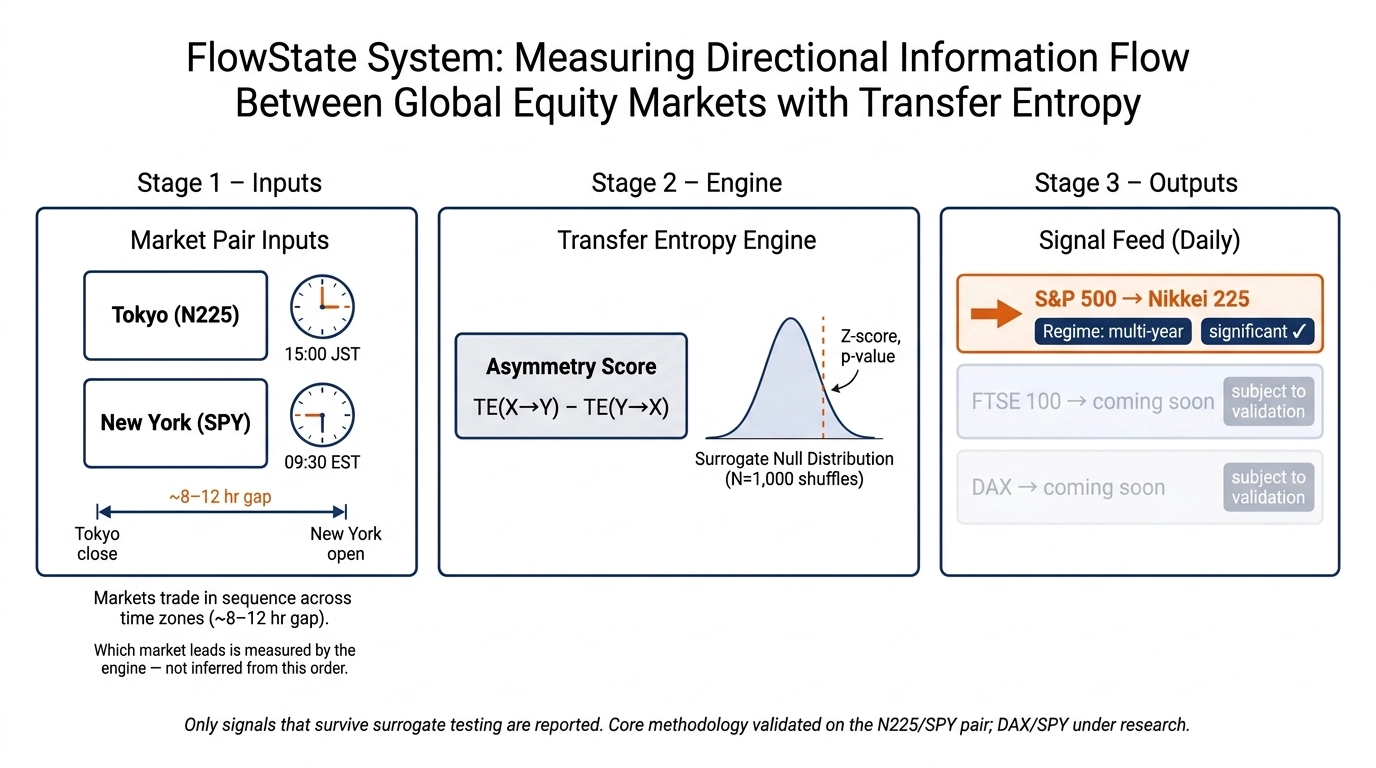
FlowState has a three-stage pipeline: market pair inputs (Tokyo/New York) with their ~8–12 hour lag annotated, a central Transfer Entropy Engine that computes a directional asymmetry score and validates it against 1,000 surrogate shuffles, and a ranked daily signal feed on the right showing which market leads which, how long the regime has persisted, and whether the signal is statistically significant.
What Makes It Unique
- Direction, not just co-movement. Correlation tells you markets are linked. FlowState tells you which one moves first — a distinction that can remain hidden for years in standard tools.
- Regime persistence scoring. Every signal is tagged with how long the directional relationship has been active, so you can distinguish a durable structural regime from a one-week artifact.
- Statistically validated. Each asymmetry reading is benchmarked against a surrogate null distribution, giving you a z-score and p-value alongside the signal — not just a number.
Use Cases
- Validate whether an overnight move in your book is noise or the continuation of a persistent directional flow.
- Benchmark your cross-market assumptions quarterly: is the leader-follower relationship you modeled six months ago still the one in the data?
Methodology
Every day, FlowState asks: does knowing what Tokyo did yesterday actually help predict what New York does today — more than New York’s own history does? If yes, and by how much, and in which direction?
That question is answered using Transfer Entropy, a technique from information theory that measures directional influence without assuming markets behave in any particular way. (Dimpfl & Peter, 2018; Kuang, 2021)
To make sure the signal is real and not a statistical fluke, each result is stress-tested against 1,000 randomly shuffled versions of the same data. Only signals that survive that test are reported.
Core methodology validated on the N225/SPY pair, with DAX/SPY under active research. Additional exchange pairs — including HSI, FTSE, ASX, and others — available on request, subject to validation.
Access
References
2021
- ElsevierMeasuring information flow among international stock markets: An approach of entropy-based networks on multi time-scalesPhysica A: Statistical Mechanics and its Applications, Jun 2021
2018
- Elsevier
2000
- APS